Log and Report
Use these screens to configure daily reporting and log settings.
What You Can Do In this Chapter
• Use the Log Settings screen (Log Settings Screen) to specify settings for recording log messages and alerts and storing them on a connected USB storage device.
• Use the SecuReporter screen (SecuReporter) to enable SecuReporter logging on your Zyxel Device, see license status, type, expiration date and access a link to the SecuReporter web portal. The SecuReporter web portal collects and analyzes logs from your Zyxel Device in order to identify anomalies, alert on potential internal/ external threats, and report on network usage.
• Use the Email Daily Report screen (Email Daily Report) to start or stop traffic collection and view reports on traffic passing through the Zyxel Device.
Log/Events Screens
The log is displayed on the following screen.
• The maximum possible number of log messages in the Zyxel Device varies by model.
Events that generate an alert (as well as a log message) display in red. Regular logs display in black. Click a column’s heading cell to sort the table entries by that column’s criteria. Click the heading cell again to reverse the sort order. The Web Configurator saves the filter settings if you leave the Log/Events screen and return to it later.
System Logs
The following table describes the labels in this screen.
Label | Description |
|---|---|
Category | Select the type of log you want to display from this list box. 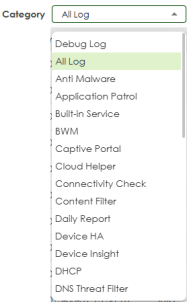 |
Clear Log | Click this button to clear the whole log, regardless of what is currently displayed on the screen. |
Export | Click this button to download logs of the chosen category to your computer in Excel (format (.xlsx). |
SecuReporter | The following category of logs show a SecuReporter icon  . Click this icon to view more historical logs in SecuReporter. You should already have a SecuReporter account. . Click this icon to view more historical logs in SecuReporter. You should already have a SecuReporter account.• Anti-Malware • Application Patrol • Content Filter • DNS Threat Filter • IP Reputation • IPS • Sandbox • URL Threat Filter |
Refresh | Click this button to update the information on the screen. |
Search | Type a keyword to look for in the Message, Source, Destination and Note fields. If a match is found in any field, the log message is displayed. You can use up to 63 alphanumeric characters and the underscore, as well as punctuation marks ()’ ,:;?! +-*/= #$% @ ; the period, double quotes, and brackets are not allowed. 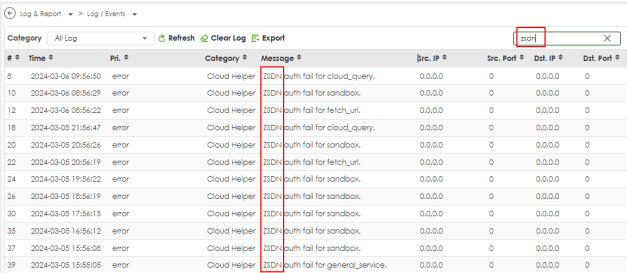 |
Filter | Click this icon  then click + to display the add filter, pick a filter, then click Search to display specific sessions according to the filter selected. You may select multiple filters, but just one of each type, configured one at a time. then click + to display the add filter, pick a filter, then click Search to display specific sessions according to the filter selected. You may select multiple filters, but just one of each type, configured one at a time. |
Priority | This displays when you click the filter icon. Select the priority of log messages to display. The log displays the log messages with this priority or higher. Choices from highest priority to lowest priority are: emergency, alert, critical, error, warning, notice, and info. |
Keyword | This displays when you click the filter icon. Type a keyword to display logs with this keyword. |
Protocol | This displays when you click the filter icon. Select a service protocol to display logs with this protocol. |
Source Address | This displays when you click the filter icon. Type the source IP address of the incoming packets to display logs with this source IP address. Do not include the port in this filter. |
Source Interface | This displays when you click the filter icon. Type the source interface of the incoming packets to display logs with this source interface. |
Source Port | This displays when you click the filter icon. Type the source port number to display logs with this source IP port. |
Destination Address | This displays when you click the filter icon. Type the IP address of the destination of the incoming packets to display logs with this destination IP address. Do not include the port in this filter. |
Destination Interface | This displays when you click the filter icon. Type the interface of the destination of the incoming packets to display logs with this destination interface. |
Destination Port | This displays when you click the filter icon. Type the destination port number to display logs with this destination IP port. |
Filter | Click this icon to display specific types of logs. Select a type or type a keyword depending on the filter chosen. 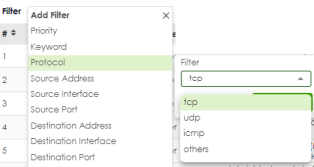 |
# | This field is a sequential value, and it is not associated with a specific log message. |
Time | This field displays the time the log message was recorded. |
Pri | This displays when you click the filter icon. Select the priority of log messages to display. The log displays the log messages with this priority or higher. Choices are: emerg, alert, crit, error, warn, notice, and info, from highest priority to lowest priority. |
Category | This field displays the log that generated the log message. It is the same value used in the Category field above. |
Message | This field displays the reason the log message was generated. The text “[count=x]”, where x is a number, appears at the end of the Message field if log consolidation is turned on and multiple entries were aggregated to generate into this one. |
Src. IP | This field displays the source IP address in the event that generated the log message. |
Src. Port | This field displays the source port number in the event that generated the log message. |
Dst. IP | This field displays the destination IP address of the event that generated the log message. |
Dst. Port | This field displays the destination port number of the event that generated the log message. |
Note | This field displays any additional information about the log message. |
Action | This field displays whether packets were dropped, blocked or if no action was taken as a result of the log. It should correspond to the action configured in Security Policy > Policy Control. |
Log Details
Double-click a log entry to display details on the log.
APC Logs
Log/Events > APThe following table describes the labels in this screen.
Label | Description |
|---|---|
Category | Select the type of log you want to display from this list box. 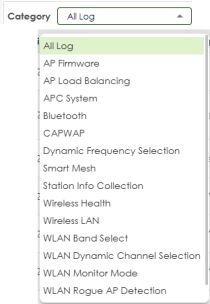 |
Clear Log | Click this button to clear the whole log, regardless of what is currently displayed on the screen. |
Refresh | Click this button to update the information on the screen. |
Search | Type a keyword to look for in the Message, Source, Destination and Note fields. If a match is found in any field, the log message is displayed. You can use up to 63 alphanumeric characters and the underscore, as well as punctuation marks ()’ ,:;?! +-*/= #$% @ ; the period, double quotes, and brackets are not allowed.  |
Filter | Click this icon  then click + to display the add filter, pick a filter, then click Search to display specific sessions according to the filter selected. You may select multiple filters, but just one of each type, configured one at a time. then click + to display the add filter, pick a filter, then click Search to display specific sessions according to the filter selected. You may select multiple filters, but just one of each type, configured one at a time. |
Priority | This displays when you click the filter icon. Select the priority of log messages to display. The log displays the log messages with this priority or higher. Choices from highest priority to lowest priority are: emergency, alert, critical, error, warning, notice, and info. |
Keyword | This displays when you click the filter icon. Type a keyword to display logs with this keyword. |
Protocol | This displays when you click the filter icon. Select a service protocol to display logs with this protocol. |
Source Address | This displays when you click the filter icon. Type the source IP address of the incoming packets to display logs with this source IP address. Do not include the port in this filter. |
Source Interface | This displays when you click the filter icon. Type the source interface of the incoming packets to display logs with this source interface. |
Destination Address | This displays when you click the filter icon. Type the IP address of the destination of the incoming packets to display logs with this destination IP address. Do not include the port in this filter. |
Destination Interface | This displays when you click the filter icon. Type the interface of the destination of the incoming packets to display logs with this destination interface. |
Filter | Click this icon to display specific types of logs. Select a type or type a keyword depending on the filter chosen. 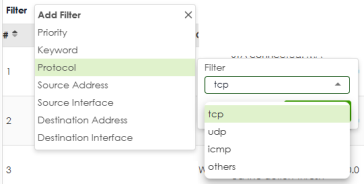 |
# | This field is a sequential value, and it is not associated with a specific log message. |
Time | This field displays the time the log message was recorded. |
Pri | This displays when you click the filter icon. Select the priority of log messages to display. The log displays the log messages with this priority or higher. Choices are: emerg, alert, crit, error, warn, notice, and info, from highest priority to lowest priority. |
Category | This field displays the log that generated the log message. It is the same value used in the Category field above. |
Message | This field displays the reason the log message was generated. The text “[count=x]”, where x is a number, appears at the end of the Message field if log consolidation is turned on and multiple entries were aggregated to generate into this one. |
Src. IP | This field displays the source IP address in the event that generated the log message. |
Src. Port | This field displays the source port number in the event that generated the log message. |
Dst. IP | This field displays the destination IP address of the event that generated the log message. |
Dst. Port | This field displays the destination port number of the event that generated the log message. |
Note | This field displays any additional information about the log message. |
Action | This field displays whether packets were dropped, blocked or if no action was taken as a result of the log. It should correspond to the action configured in Security Policy > Policy Control. |
AP Logs
Log/Events > APThe following table describes the labels in this screen.
Label | Description |
|---|---|
AP Selection | |
Select on AP | Select an AP from this list box to view its AP logs. Click Query. |
Log Query Status | This field displays the current status of the Zyxel Device retrieving the AP logs. Init: The Zyxel Device is ready to retrieve the AP logs. Querying: The Zyxel Device is retrieving the AP logs. Success: The Zyxel Device has successfully retrieved the AP logs. Query Fail: The Zyxel Device fails to retrieved the AP logs. This occurs when the connection between the Zyxel Device and the AP is unstable. To check the connection status between the Zyxel Device and the AP, go to Log & Report > Log/Events >APC. |
Log Query Information | |
AP Information | This field displays the MAC address of the selected AP. |
Log File Status | This field displays the current status of the AP logs. Empty: The Zyxel Device has no AP logs available. Exist: The Zyxel Device contains AP logs retrieved from the currently connected AP. Last: The Zyxel Device saves the AP logs from the previous query. |
Last Log Query Time | This field displays the most recent time the Zyxel Device retrieved the AP logs. |
Category | Select the type of log you want to display from this list box. 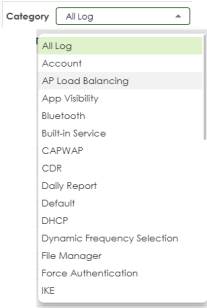 |
Clear Log | Click this button to clear the whole log, regardless of what is currently displayed on the screen. |
Filter | Click this icon  then click + to display the add filter, pick a filter, then click Search to display specific sessions according to the filter selected. You may select multiple filters, but just one of each type, configured one at a time. then click + to display the add filter, pick a filter, then click Search to display specific sessions according to the filter selected. You may select multiple filters, but just one of each type, configured one at a time. |
Priority | This displays when you click the filter icon. Select the priority of log messages to display. The log displays the log messages with this priority or higher. Choices from highest priority to lowest priority are: emergency, alert, critical, error, warning, notice, and info. |
Keyword | This displays when you click the filter icon. Type a keyword to display logs with this keyword. |
Filter | Click this icon to display specific types of logs. Select a type or type a keyword depending on the filter chosen. 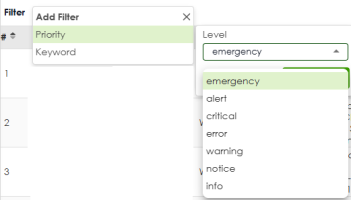 |
# | This field is a sequential value, and it is not associated with a specific log message. |
Time | This field displays the time the log message was recorded. |
Pri | This displays when you click the filter icon. Select the priority of log messages to display. The log displays the log messages with this priority or higher. Choices are: emerg, alert, crit, error, warn, notice, and info, from highest priority to lowest priority. |
Category | This field displays the log that generated the log message. It is the same value used in the Category field above. |
Message | This field displays the reason the log message was generated. The text “[count=x]”, where x is a number, appears at the end of the Message field if log consolidation is turned on and multiple entries were aggregated to generate into this one. |
Src. IP | This field displays the source IP address in the event that generated the log message. |
Dst. IP | This field displays the destination IP address of the event that generated the log message. |
Note | This field displays any additional information about the log message. |
Log Settings Screen
The Log Settings screen control log messages. A log message stores the information for viewing or regular emailing later.
The Zyxel Device provides a system log and supports email profiles and remote syslog servers. Use the email profiles to mail log messages to the specific destinations. You can also have the Zyxel Device store system logs on a connected USB storage device. The other two logs are stored on specified syslog servers.
The following table describes the labels in this screen.
Label | Description |
|---|---|
Log Category Setting | Select which events you want to log for the Zyxel Device by Category. There are three choices: Disable - do not log any information from this category Normal - create log messages and alerts from this category Debug - create log messages, alerts, and debugging information from this category; the Zyxel Device does not email debugging information, however, even if this setting is selected. |
AP & APC Log Settings | Select which events you want to log for the AP and APC by Category. There are two choices: Disable - do not log any information from this category Normal - create log messages and alerts from this category. |
System Log | |
Log Consolidation | Enable this to activate log consolidation. Log consolidation aggregates multiple log messages that arrive within the specified Consolidation Interval. In Log Category Setting, the Count field is the number of original log messages when multiple log messages were aggregated. |
Consolidation Interval | Type how often, in seconds, to consolidate log information. If the same log message appears multiple times, it is aggregated into one log message in the Count field in Log Category Setting. |
USB Storage | |
Enable USB Storage | Enable this if you want to use a connected USB device. The USB log file is saved as YYYY-MM-DD.log where YYYY-MM-DD is the current system date. The Zyxel Device supports USB file systems FAT16, FAT32, EXT3, and EXT4. |
Enable Log Rotation by File Size | Use this to maximize the size of a file containing logs on the USB stick. Any number of files, each up to the maximum size, can be saved to the USB stick daily. ‘Rotated’ log files, for example, 2025-01-03.log.1, 2025-01-03.log.2. etc., are also saved to the USB stick. |
Rotate Based On File Size | Set the maximum size of a file containing logs on the USB stick. For example, if you set this to 100MB, and the 2025-01-03.log file exceeds 100MB, then the contents of 2025-01-03.log is moved to 2025-01-03.log.1, so that logs can be added to 2025-01-03.log again. If the 2025-01-03.log.1 already exists, then 2025-01-03.log.1 is renamed to 2025-01-03.log.2, and its content is then moved from 2025-01-03.log to 2025-01-03.log.1. |
File Size Check Interval | Set how often to check log file sizes on the USB stick. The range is from 1 to 360 minutes. The default is 5 minutes. |
Enable Compression | Enable this to gzip log files to reduce size. You will be able to save more log files to the USB stick, but you will have to have to unzip them first to perform analysis of the logs. ‘Rotated’ compressed log files, for example, 2025-01-03.log.1.gz, 2025-01-03.log.2.gz etc., are also saved on the USB stick. |
Log Keep Duration | Set a number of days (1 to 365) that the Zyxel Device keeps a log file on the USB stick. When a log file exceeds the number of days set here, the file is deleted from the USB stick. When the USB stick is full, new logs are not sent to the USB stick until files are removed from there. |
USB Disk Full Warning | Enable this to create a log when the available space on the USB stick connected to the Zyxel Device is below the specified threshold. |
Threshold (Remaining Space) | Set the minimum size needed to save logs on the connected USB stick (100 to 9999) in MB. When the available space on the USB stick is below this value, a log will be created. The default value is 200 MB. |
Purge old file when reached threshold | If the available space on the USB stick is below the specified threshold, the oldest log files will be removed until the available space is above the threshold. Then, the new logs can be saved to the USB stick. |
Remote Syslog Server | |
Remote Server 1/2 | |
Active | Enable this to send log information according to the information in this section. |
Log Format | This field displays the format of the log information. It is read-only. Syslog - syslog compatible format. CEF/Syslog - Common Event Format, syslog-compatible format. |
Server Address | Type the server name or the IP address of the syslog server to which to send log information. |
Server Port | Type the service port number used by the remote server. |
Log Facility | Select a log facility. The log facility allows you to log the messages to different files in the syslog server. Please see the documentation for your syslog program for more information. |
Apply | Click Apply to save your changes back to the Zyxel Device. |
Cancel | Click Cancel to return the screen to its last-saved settings. |
SecuReporter
SecuReporter is a security analytics portal that collects and analyzes logs from SecuReporter-licensed Zyxel Devices in order to identify anomalies, alert on potential internal / external threats, and report on network usage. You need to buy a license for SecuReporter for your Zyxel Device and register it at NCC.
If a license has expired, you will see a reminder in this screen. You need to renew the license in order to keep using the feature. Click Buy Now to go to Marketplace to purchase a new license. Click See Details to go to the Zyxel web page to find more information on licenses for your Zyxel Device. 
How to activate and enable SecuReporter
1 If SecuReporter Service Status does not display Activated, you have to log in to NCC and activate the SecuReporter license for this Zyxel Device. The Zyxel Device must be able to communicate with the NCC server.
2 After the SecuReporter license is activated, go back to the Log & Report > SecuReporter screen, and select the categories of logs that you want this Zyxel Device to send to the SecuReporter portal.
3 Slide the switch to the right under General Settings to enabled SecuReporter. Do not go to the SecuReporter portal until after you have enabled SecuReporter on this Zyxel Device and applied the settings. You can also see license status, type, expiration date.
4 Click Apply and wait.
How to add this Zyxel Device to SecuReporter
1 Log in to the SecuReporter portal.
2 Go to More > Organization & Devices, click Add Organization to create an organization.
3 Add this Zyxel Device to the organization you created using the hyper link under Unclaimed.
The following table describes the labels in this screen.
Label | DESCRIPTION |
|---|---|
Enable | This must be enabled to have SecuReporter collect and analyze logs from this Zyxel Device. Click SecuReporter tutorial video to go to YouTube to see related configuration videos. It’s selected by default if you have activated a SecuReporter license. |
Categories | Select the categories of logs that you want this Zyxel Device to send to SecuReporter for analysis and trend spotting. You need an active license for the Security categories. |
Apply | Click Apply to save your changes back to the Zyxel Device. |
Cancel | Click Cancel to return the screen to its last-saved settings. |
Email Daily Report
Use the Email Daily Report screen to start or stop data collection and view various statistics about traffic passing through your Zyxel Device. Click the Mail Server link under Note to set up the mail server in the Notification screen.
Configure this screen to have the Zyxel Device email you system statistics at the specified time.
The following table describes the labels in this screen.
Label | Description |
|---|---|
Enable Email Daily Report | Select this to send reports by email every day. |
Reset All Counters | Click this to discard all report data and start all of the counters over at zero. |
E-mail Subject | Type the subject line for outgoing email from the Zyxel Device. Type a string using up to 60 of these characters [a-zA-Z0-9’()+,./:=?;!#@$_%-]. |
E-mail From | Type the email address from which the outgoing email is sent. |
E-mail To | Type the email address (or addresses) to which the outgoing email is delivered. |
Send Report Now | Click this button to have the Zyxel Device send the daily email report immediately. Check your spam mail folder if you cannot receive the report. |
Reset counters after sending report successfully | Select Reset counters after sending report successfully if you only want to see statistics for a 24 hour period. |
Report Items | Select the information to include in the report. Types of information include System Resource Usage, Traffic Statistics, Security Services and System Information. |
Schedule | Select the time of the day the report is emailed. |
Apply | Click Apply to save your changes back to the Zyxel Device. |
Cancel | Click Cancel to return the screen to its last-saved settings. |